
WordPress 404 Errors: 21,000 Renders in 20 Days, Traced
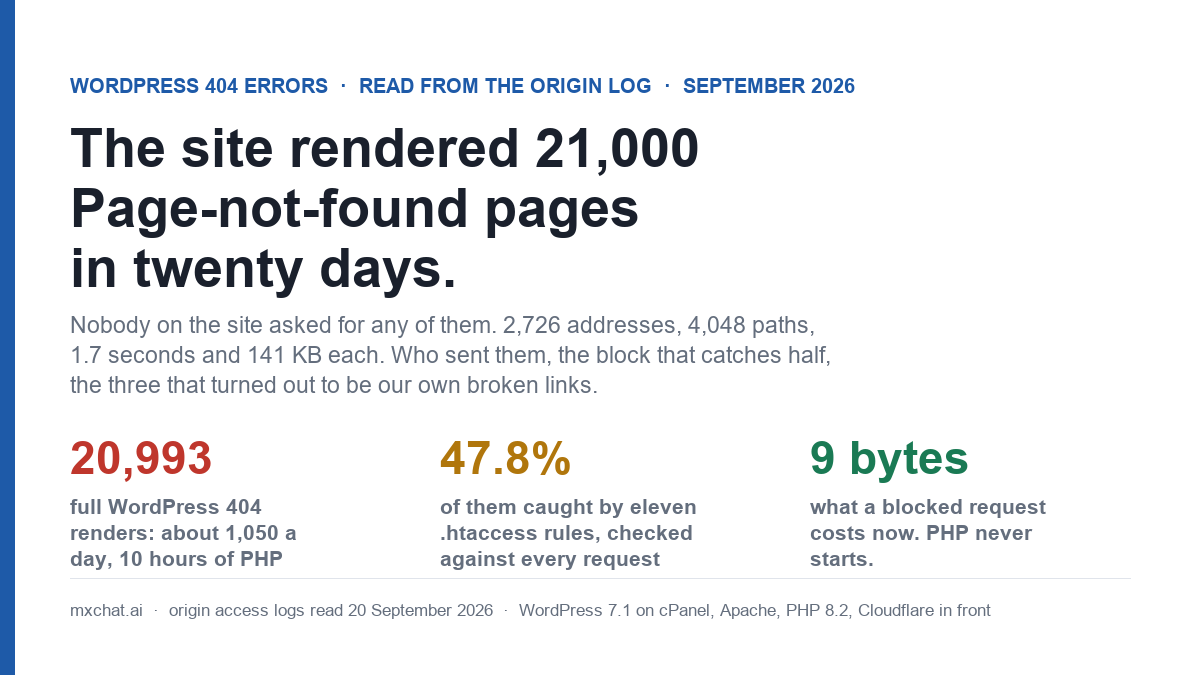
Yesterday’s post ended with a promise I did not expect to keep this quickly: now that a denied request costs this server nine bytes instead of a full page, the scanner wordlist paths were worth a block. So I read the whole 404 column of the origin logs, both ports, for the twenty days since 31 August. 34,027 requests got a 404. WordPress rendered its Page not found template for 20,993 of them, at 141,869 bytes and about 1.7 seconds each, which is a little over ten hours of PHP and three gigabytes of HTML for pages nobody on the site had linked to. That is the whole WordPress 404 problem on a small site, seen from the inside: not the broken permalinks the how-to guides fix, but a thousand renders a day for files that were never there.
This post is the population, the cost, what was actually being asked for (one scanner alone is a quarter of it), the eleven rules I added to .htaccess after checking every one of them against every request in the window, and the three 404s that turned out to be our own broken links, which the same log found for free. The site is WordPress 7.1 on cPanel with Apache and PHP 8.2, Cloudflare in front, the same install as the ErrorDocument, port-80 and OPcache posts. Every number is from its own logs.
Thirty-four thousand 404s, and who answered them
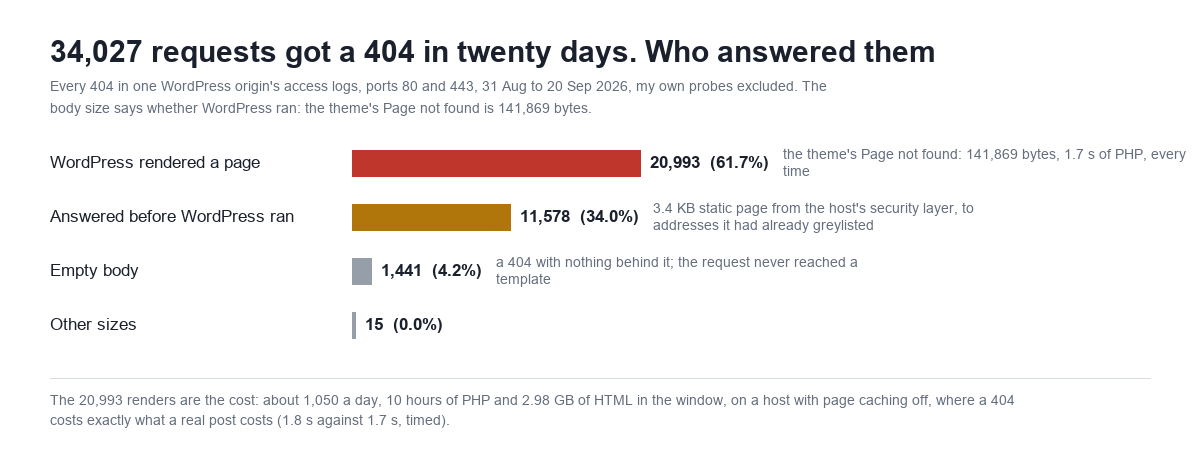
A 404 is a status code, not a cost. What a request costs depends on what answered it, and the access log tells you that in the bytes column. On this host there were three answers.
| Who answered | Requests | Body | What it cost |
|---|---|---|---|
| WordPress, the theme’s Page not found | 20,993 (61.7%) | 141,869 bytes | A full bootstrap and render: 1.7–1.9 s, 48 plugins loaded, every time |
| The host’s security layer, before WordPress | 11,578 (34.0%) | 3,420 or 3,424 bytes | A static page. The same addresses were getting the firewall’s block page on /; I could not reproduce this answer from outside in eight tries and I do not count it |
| Nothing: an empty 404 | 1,441 (4.2%) | 0 bytes | The request never reached a template |
| Other | 15 | various | — |
The 20,993 are the number that matters, and they are the number the rest of this post is about. Fourteen thousand nine hundred came over HTTPS and 6,095 over plain HTTP, which on this site means straight to the origin’s address rather than through Cloudflare; the port-80 post explains why that log exists at all. They came from 2,726 addresses and asked for 4,048 distinct paths. Half of those paths (1,912) were requested exactly once. The other half were requested 19,081 times between them, and the fifty most-requested paths account for 7,949 renders, 38% of the total.
One thing to say before the arithmetic, because it changes what the arithmetic means: this site has page caching off, and has for reasons that predate me and are not about 404s (WooCommerce, a chat widget that renders per visitor). I timed a real post and a made-up path back to back, three runs each, at the origin: the post took 1.7 seconds and the 404 took 1.8. A 404 here costs exactly what a page costs. Nothing about the 404 template is to blame; it is the WordPress bootstrap that the OPcache post measured, paid once per request, for a request that will produce nothing.
A thousand a day, and one scanner made two of the days
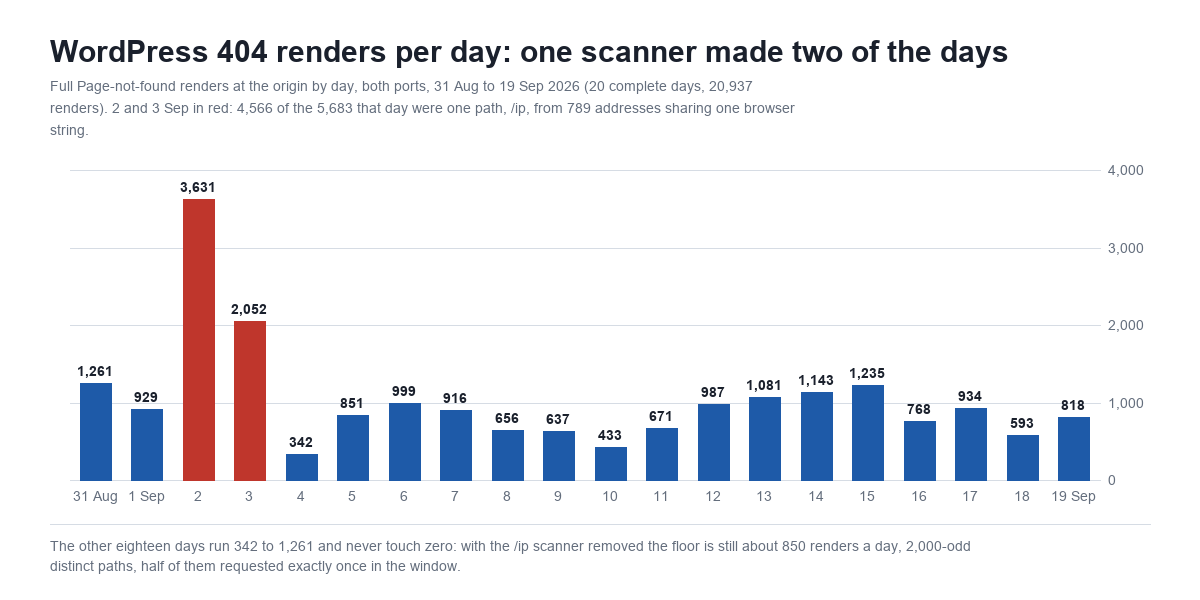
Twenty complete days, 20,937 renders, 1,047 a day. At the timed 1.75 seconds that is about thirty minutes of PHP a day, ten hours across the window; at 141,869 bytes each it is 2.98 GB of HTML sent to clients that discarded it. The two red days are a single request path, /ip, asked for 5,063 times by 789 addresses that all sent the same Mac Chrome 114 browser string and no Referer, and between them asked for almost nothing else (460 other requests, mostly admin-ajax.php): 3,048 requests on 2 September, 1,518 on the 3rd, a trickle since. It is one tool checking whether a proxy or a debug endpoint echoes the caller’s address, and it is 24% of every 404 render this site produced in three weeks.
Take it out and the floor is still about 850 a day. That floor is the interesting part, because no single rule reaches it.
What was being asked for
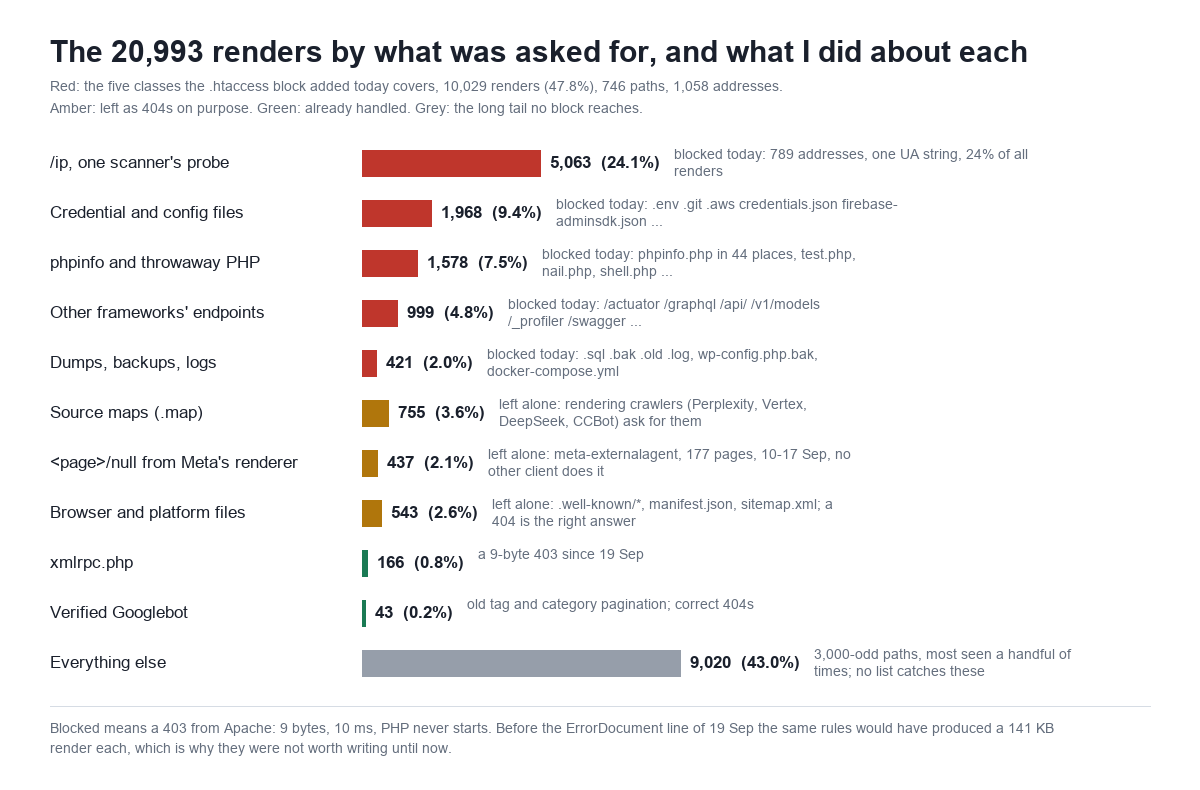
Credential and configuration files are the class the hardening guides talk about, and they are here in volume: .env in every directory a scanner can think of (1,300 requests across all statuses, 515 of them renders), .git/config (879), .aws/credentials, .ssh, .npmrc, and a newer generation of names that did not exist in the wordlists of five years ago: credentials.json, service-account.json, firebase-adminsdk.json, gcp-credentials.json, appsettings.json, key.json. Two names in that set are worth pausing on for anyone who runs an AI chatbot on WordPress: openai.json (28 requests) and anthropic.json (27), alongside probes for /v1/models (45) and /v1/chat/completions (12), which are the OpenAI-compatible endpoints a misconfigured proxy would expose. Scanners are now looking for LLM keys and open LLM proxies as a matter of routine. A WordPress chatbot plugin keeps its keys in the database, not at a URL, so these find nothing here; but a site that has ever dropped a config export in the web root should assume it has been read.
One detail I only saw because I verified the block through the proxy afterwards: Cloudflare already answers /.env with its own 403 page (5,482 bytes, a managed rule). Every .env request in the origin log therefore came to the origin’s IP address directly, around the proxy. That is the same population the port-80 post found, and it is why an origin-side block is still worth having on a site behind a WAF.
phpinfo and throwaway PHP is 44 different places a scanner thinks a phpinfo.php might be (admin/, public/, tmp/, old/, _profiler/phpinfo, old_phpinfo.php), plus the root-level names that a WordPress install never has: test.php, info.php, nail.php, shell.php, wp_filemanager.php. Other frameworks’ endpoints is the scanner not knowing what it is talking to: Spring’s /actuator, Laravel’s /telescope and /_ignition, Symfony’s /_profiler, /graphql in three spellings, /swagger, and 595 requests under /api/ for a site whose only API is at /wp-json/. Dumps and backups is .sql, .bak, wp-config.php.bak, docker-compose.yml, and one class larger than I expected: 3,145 requests in the window for files ending in .sql, .bak, .old or similar, of which 760 reached WordPress as renders and the rest were stopped above it by the firewall plugin and the host.
Then there are the classes I read and deliberately left as 404s. Source maps: 755 requests for .map files next to our JavaScript, from 16 addresses, almost all of them rendering crawlers that run a real browser (PerplexityBot 58, Google-CloudVertexBot 58, DeepSeekBot 53, CCBot 53, an unlabelled Linux Chrome 114). A headless Chrome with developer tooling attached asks for source maps; no browser user does. They are harmless and a 404 is the truthful answer, and a 403 would tell those crawlers nothing useful. Platform files: /.well-known/traffic-advice (168, Chrome’s privacy-preserving prefetch proxy asking whether it may prefetch, from Google addresses), /.well-known/assetlinks.json (88, Android app-link verification), /.well-known/passkey-endpoints (43), manifest.json (51), sitemap.xml (53; ours is sitemap_index.xml). These are asked for by browsers and by Google, a 404 means “not offered”, and a deny would be wrong.
And one class that is neither a scanner nor a browser: 437 requests for <page>/null, every one from Meta’s crawler (meta-externalagent/1.1, running Chrome 145, from 70 addresses in one Facebook /48), spread over 177 different pages between 10 and 17 September, each with the page itself as Referer. Meta fetched 7,915 things from this site in the window and rendered the pages with JavaScript on; something on our pages, executed by that renderer and by no other client in the log (not Googlebot’s, not any human browser), resolved to the string null and asked for it. I read the six first-party scripts on the page and each fetches a fixed admin-ajax URL; the cause is not in them. It stopped on the 17th, so I am filing it, not fixing it, and it goes in this post because the rule it teaches is the one the next section is about: a 404 with a page of your own as Referer is a link you wrote, whatever wrote it.
Verified Googlebot, for completeness, produced 43 of the 20,993: old paginated tag and category pages (/tag/mxchat/page/12/ eleven times, /tag/enhance-user-engagement/page/3/ fourteen) that existed when those tags had more posts. Google checks whether a page it once saw is back; a 404 is the right answer and costs nothing in ranking. It also fetched two of the three broken links below, which is how a broken internal link becomes a crawl-budget line.
Update, 21 September: those 43 requests got their own read. Verified Googlebot spent 319 of its 1,627 HTML fetches in the same window on tag archives, 94 of them on archives with no posts at all, and 438 of the site’s 1,305 tags turned out to be empty. The inventory, the crawler that sent 44% of the tag traffic, and what was deleted are in WordPress tags SEO: 1,305 archives, 421 posts, 7 clicks.
The three that were ours
The cheapest broken-link checker a WordPress site has is the 404 column filtered to requests whose Referer is one of its own pages. The link-checking pass I ran in July walked post bodies and found the links in them; it could not see a link emitted by a template, a plugin’s config array or a stylesheet enqueue, and the log can.
| Path | Requests | Where the link was | Fix |
|---|---|---|---|
/pricing/ | 68 | The primary “Get MxChat Pro” button on three add-on pages, from a plugin config array, and 14 add-on docs pages. The page never existed. | 301 to the Pro product page, shipped 19 September; the config fix is queued |
/add-ons/mxchat-migration-tool/documentation/ | 53 | The documentation hub links fifteen add-on docs pages. Fourteen exist. This one never has; each request was a 391 KB render of the gallery’s not-found template, six with the hub as Referer, two from Googlebot. | 301 to the add-on’s own page, shipped today; the docs file is queued |
…/bbpress-modern-ui/assets/css/archive-forum.css | every /forums/ view | The forum theme plugin enqueues a stylesheet that is not in its assets/css/ directory. Every visitor to the forum index pays a second 1.7 s render for a stylesheet that arrives as a Page-not-found HTML document. | Plugin fix queued; the file is one of four the plugin ships, the enqueue names a fifth |
Three broken links in twenty days, on a site that had been link-checked two months earlier, all three from code paths a body-text sweep cannot walk. None of them was in Search Console’s crawl report yet. The rule I am keeping: the internal-404 sweep needs a log arm as well as a body-text arm, and the log arm is one awk filter.
The block, and the rule for writing one
Eleven rules went into .htaccess this morning, after the ErrorDocument line from Thursday that makes a deny cost nine bytes. Before that line these rules would have been actively harmful here: each match would have handed a 403 to WordPress to render as a 404, and the 141 KB page would have been served either way.
# BEGIN BLOCK SCANNER PATHS
<IfModule mod_rewrite.c>
RewriteEngine On
# one scanner's probe path: 5,063 requests from 789 addresses, one UA string
RewriteRule ^ip$ - [F,L]
# dotfiles and dot-directories at any depth, except .well-known
RewriteCond %{REQUEST_URI} !^/\.well-known/
RewriteRule (^|/)\.(env|git|svn|hg|aws|ssh|npmrc|netrc|vscode|idea|DS_Store|htpasswd|dockerenv)([./]|$) - [F,L]
# credential and config dumps at the root
RewriteRule ^(credentials|service-account|firebase-adminsdk|gcp-credentials|appsettings|key|config|secrets?|settings|env|aws-exports|application|openai|anthropic)\.(json|yml|yaml|js|py|toml|txt|properties)$ - [F,L]
# phpinfo and its cousins, any directory
RewriteRule (^|/)([a-z_-]*phpinfo[a-z_-]*|php-info|php_info|phpversion|server-status|server-info|wp_filemanager)(\.php)?$ - [F,L]
# throwaway root-level PHP names no WordPress install has
RewriteRule ^(info|test|i|p|pi|admin|shell|cmd|nail|up|upload|x|xx|xxx|1|2|123|wp|ws|w|s|z|zz|alfa|bak|old|new|about|av|php|pinfo|debug)\.php$ - [F,L]
# other frameworks' debug and admin endpoints (nothing here routes them)
RewriteRule ^(actuator|telescope|_ignition|_profiler|_debugbar|debug|swagger|graphql|v1|api|console|phpmyadmin|pma|myadmin|adminer|administrator)(/|$) - [F,L]
# dumps, backups, editor leftovers, logs
RewriteRule \.(sql|sql\.gz|sql\.zip|sql\.tar\.gz|bak|old|orig|save|swp|swo|log)$ - [F,L]
RewriteRule ^wp-config(\.php)?[.~-] - [F,L]
RewriteRule ^(docker-compose\.ya?ml|Dockerfile|composer\.(json|lock)|package(-lock)?\.json|yarn\.lock|Gemfile|Makefile)$ - [F,L]
RewriteRule ^cgi-bin(/|$) - [F,L]
</IfModule>
# END BLOCK SCANNER PATHS
Every rule passed the same three checks against the full twenty-day log before it went in, and I would not ship one that failed any of them. First, no request matching the rule ever got a 200 (the exception is wp-config-sample.php, a core file that should not be served anyway). Second, nothing on the site links to a matching path: the rendered HTML of the pages references none of them. Third, no matching request ever carried a browser user agent together with a page on this site as Referer, which is the signature of a real visitor following a real link. The one rule I drafted that failed, I threw away: ^(wp|wordpress|blog)/, to catch scanners looking for WordPress in a subdirectory, also matched 888 requests that got a 200, with the admin dashboard as Referer. I do not know what makes them yet, and a rule you cannot explain is a rule you do not ship.
Applied with a backup and a 52-check script that restores the backup on any failure: the front page, a post, the REST root, the admin redirect, the login page, a core script, a plugin stylesheet whose name contains phpinfo (Wordfence ships one; the rule is anchored so it does not match), the shop, the account page, the forum, feeds, the sitemap, wp-cron.php, an ACME challenge path (must stay 404, not 403), a real missing page (must stay 404, not 403), manifest.json and a source map (404), and then twenty-eight paths that must now be 403. It held first time.
| Request | Before (19 Sep, timed) | After (20 Sep, median of 3) |
|---|---|---|
/ip | 404, 141,869 bytes, 1.8 s | 403, 9 bytes, 10 ms |
/.env | 404, 141,869 bytes, 1.8 s | 403, 9 bytes, 10 ms |
/credentials.json | 404, 141,869 bytes, 1.8 s | 403, 9 bytes, 10 ms |
/api/config | 404, 141,869 bytes, 1.8 s | 403, 9 bytes, 9 ms |
/phpinfo.php | 404, 141,869 bytes, 1.8 s | 403, 9 bytes, 9 ms |
/no-such-page/ (a real miss) | 404, 141,869 bytes, 1.8 s | 404, 141,869 bytes, 1.8 s: unchanged, on purpose |
Replayed against the window, the eleven rules match 10,029 of the 20,993 renders (47.8%), 746 distinct paths from 1,058 addresses. At the timed cost that is 4.9 hours of PHP and 1.4 GB of HTML the server would not have produced in those twenty days; at the run rate, about fourteen minutes of PHP a day, on a host that has no OPcache and whose every request loads 48 plugins.
What this does not fix, and the honest options
The other 52% is a long tail, and no list reaches it. Nine thousand renders across some three thousand paths, nearly two thousand of them seen once. Wordlists are large and scanners rotate them; a block written from this month’s log will catch a little less of next month’s. The classes I blocked are the stable ones, the paths that have been in scanner wordlists for years and will be in them next year, and 48% is what stability buys you. There are three things that would reach the tail, and none of them is a rewrite rule.
Page caching. 19,081 of the 20,993 renders (90.9%) were repeat requests for a path already rendered once. A page cache that stores 404 responses would have served nine in ten of them from disk in about ten milliseconds. This site’s page cache is off, and it is off for reasons that have nothing to do with 404s; turning it on is a decision about the shop and the chat widget, not about scanners, and it is not mine to make in a post about .htaccess. If your page cache is on, check whether it caches 404s: on this evidence it is the single largest lever.
Refusing traffic that is not from the proxy. Cloudflare’s own rules already stop .env and the like at the edge. The scanners in this log did not go through the edge; they went to the origin’s IP. A host firewall that accepts port 80 and 443 only from Cloudflare’s published ranges makes the whole origin log, 404s included, a Cloudflare log. That is a server change with a failure mode (Cloudflare’s ranges change; ACME renewals need thought), which is why it is the right fix and not this morning’s.
Making the render cheaper. The admin-ajax post and the OPcache post between them found about half a second per request in things this install does on every bootstrap that it does not need to; one of those fixes is built and waiting for a release. A cheaper bootstrap makes every 404 cheaper too, which is worth saying because it is the only fix on this list that helps the tail and the real pages alike.
Doing this on your own site in fifteen minutes
- Get the 404 column with sizes. On cPanel:
awk '$9==404 {print $10, $7}' ~/access-logs/yourdomain.com-ssl_log | sort | uniq -c | sort -rn | head -60. The first number per line is the body size; anything the size of your theme’s 404 page is a full render. - Find your own broken links first.
awk '$9==404' … | grep '"https://yourdomain.com/'and read the Referer column. Fix those before you block anything; they are the only 404s that cost you visitors. - Read the top paths and sort them into the classes above. Leave
.well-known/,manifest.json,favicon.ico,apple-touch-icon, source maps and anything Googlebot asks for as 404s. - Before each rule, run the three checks: any 200 ever, any link on the site, any browser request with your own page as Referer. A rule that fails one is not a rule.
- Make sure a deny is cheap before you add denies. Time one: if a 403 on your host takes more than a few tens of milliseconds and returns more than a few bytes, read the ErrorDocument post first, because your denies are renders.
- Apply with a backup and a check list that includes your admin redirect, login page, REST root, sitemap, a real missing page (must stay 404) and an ACME challenge path (must not become 403), and restore automatically if any check fails.
- Re-read the log in a month. The tail moves; the classes do not. If a new path shows up in the hundreds, it is a rule; if it shows up once, it is the tail.
Frequently asked questions
Do 404 errors hurt WordPress SEO?
Not these. Google’s own 43 requests here were for pages that used to exist, and a 404 is the correct answer for them; Search Console lists them as “Not found (404)” and moves on. What hurts is a 404 behind a link on your own site, because a visitor or a crawler followed it expecting a page. That is why the log’s Referer column is the part to read first: it separates the three 404s that were ours from the twenty thousand that were not.
Why not just block the IP addresses?
Because there are 2,726 of them and they change. The /ip scanner used 789 addresses in two days, and the credential scanners came from cloud ranges that host legitimate crawlers too. A path rule outlives any address list, and it is honest about what it blocks: a request for a file that has never existed, from anyone.
Will blocking /api/ or /graphql break a plugin?
Only if a plugin routes them, and the way to know is not to guess. wp rewrite list shows every registered route; on this site nothing begins with api, v1, graphql or debug, and the log agrees: 3,540 requests under /api/ in twenty days, none of them a 200. If you run WPGraphQL, the graphql rule is one you remove; if you have an /api/ route, the log will show 200s for it and the first check fails.
Should I block source maps and manifest.json too?
I would not. Source maps are asked for by rendering crawlers (Perplexity, Google’s Vertex crawler, DeepSeek, Common Crawl) and by any developer with the tools panel open; manifest.json, .well-known/ paths and the Chrome prefetch-proxy file are asked for by browsers and by Google as part of how the web works. A 404 says “not offered”, which is true. A 403 says “you may not”, which is not what you mean, and on some of those paths it can change a browser’s or a crawler’s behaviour toward your site.
What about the 11,578 that the security layer answered?
They are the cheap third: a 3.4 KB static page, no WordPress, sent to addresses the host’s firewall had already flagged. I could not reproduce that answer from outside (eight variations of host header, protocol and path), so I have not timed it and I do not count it in the cost. What it shows is the layering on a shared host: the edge, then the host’s firewall, then Apache’s rules, then WordPress. Each one that answers a request stops the next from paying for it, and this morning’s block moved 48% of the renders one layer up.


