admin-ajax.php in WordPress: 16,281 Hits in 14 Days, Sorted
admin-ajax.php is the file in wp-admin that every WordPress plugin is allowed to phone. It boots the whole site, reads one action parameter, runs whatever function claimed that name, and hangs up. The name says “admin” but the front end uses it just as freely, so the file shows up in two places site owners actually look: the hosting panel’s “top requests” table and the slow-query alerts. What it rarely comes with is an answer to the obvious question, which is who is calling it.
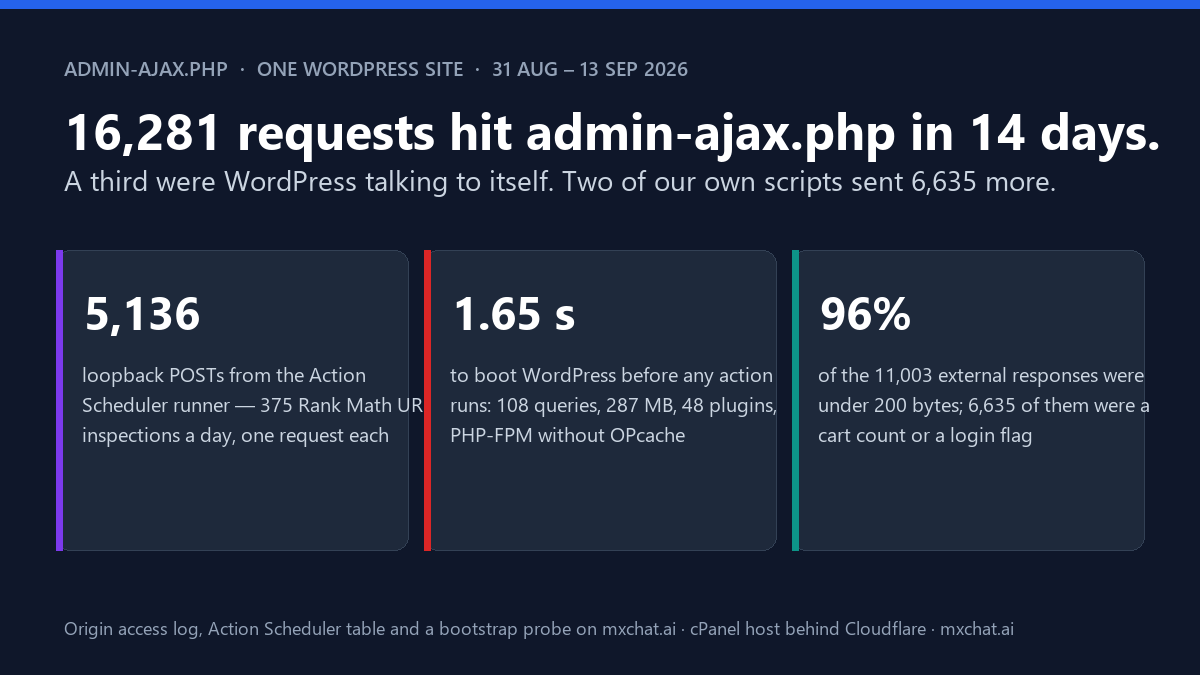
We counted. Over fourteen days, 31 August to 13 September 2026, this site’s origin access log recorded 167,376 requests, and 16,281 of them, one in ten, were to /wp-admin/admin-ajax.php. Sixty percent of every POST the server received in that fortnight went to that one file. Sorted by who sent them, the answer is not what the “reduce admin-ajax load” guides assume: a third of the traffic was WordPress talking to itself, and the two biggest front-end callers were two scripts of our own, fetching a cart count and a login flag on every page view. The chat widget this site sells, the thing you would expect to dominate, is a rounding error.
This post is that count, what each request costs on this host (measured: 1.65 seconds and 108 database queries before the action even runs), and what to do about it in the order that matters. It is the same log yesterday’s denial-of-wallet post read for the chat endpoint, cut a different way.
What admin-ajax.php is, in one paragraph
The file itself is about 200 lines. It defines WP_ADMIN as true, loads wp-load.php, which loads every active plugin and the theme, sends “never cache this” headers, and then fires one of two hooks: wp_ajax_{action} if the visitor is logged in, wp_ajax_nopriv_{action} if not. If no function is registered for the name it prints 0 with a 400 status and exits. That is the whole design. Three consequences follow. Every request pays the full bootstrap regardless of how trivial the action is. Nothing in front of the file (page cache, CDN) can cache it, by its own instruction. And because WP_ADMIN is true, every admin-ajax request counts as an admin request to anything that checks is_admin(), which turns out to matter more than it sounds.
16,281 requests, sorted by sender
The classification is mechanical. Loopback means the request came from the server’s own address. Crawler means the user-agent field, and only that field, matched a bot pattern (a whole-line grep counts every visitor arriving from a URL with “bot” in it; we made that mistake yesterday and corrected it). Everything else external is a browser.
| Sender | Requests | Share | What it was |
|---|---|---|---|
| Browsers on public pages | 8,267 | 50.8% | 3,611 responses of exactly 55 bytes and 3,024 of exactly 78 bytes (compressed on the wire; 35 and 66 raw): a WooCommerce cart count and a logged-in check, sent by two site scripts on page load. Only 42 responses in the fortnight exceeded 3 KB. |
| Action Scheduler loopback runner | 5,136 | 31.5% | action=as_async_request_queue_runner, no Referer, a random twelve-character user agent, every one a 200. The site running its own background queue. |
| Crawlers rendering the page | 2,689 | 16.5% | Baiduspider 878, Applebot 515, YouBot 450, Meta 327, Googlebot 216 (all verified), then Ahrefs, AdsBot, Bingbot, Sogou, Yandex. JavaScript-rendering crawlers execute the same page scripts a browser does. |
| GET requests | 89 | 0.5% | 21 from Wordfence’s own scanner (loopback); 68 from outside, 48 of them rejected with 403, almost all probes for plugins this site does not run. |
| Other loopback | 53 | 0.3% | Imagify’s optimiser 37, WooCommerce privacy cleanup 13, Wordfence self-test 2, one unnamed. |
| Logged-in admin session | 47 | 0.3% | Heartbeat and dashboard calls from one address. The thing the file is named after. |
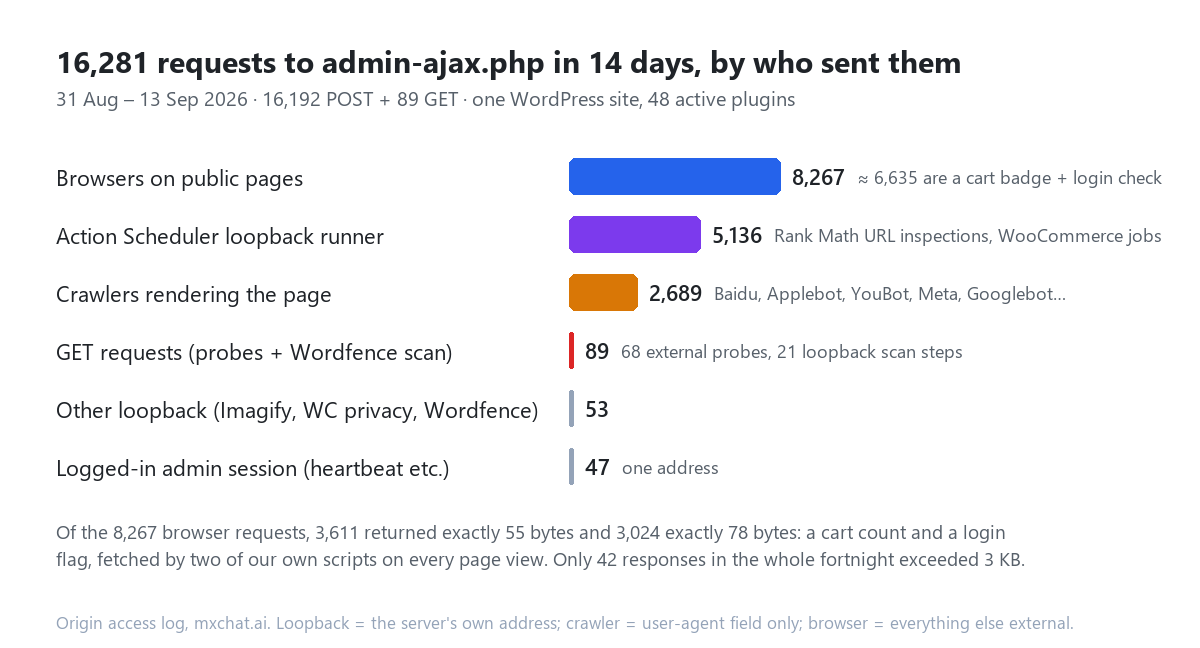
Read the top two rows together. Thirteen thousand of the sixteen thousand requests were either the site fetching two small numbers for its own header, or the site running its own to-do list. Neither is a visitor. Neither is the chatbot. Both are the kind of thing a site accumulates without anyone deciding to.
Row two: WordPress talking to itself, 5,136 times
Action Scheduler is the job queue that ships inside WooCommerce and that Rank Math, WPForms, Jetpack and dozens of other plugins use for background work. It has two ways to run a due action. The first is WP-Cron. The second is an “async request”: when a request finishes in an admin context and actions are due, it fires a non-blocking POST at admin-ajax.php?action=as_async_request_queue_runner, and that request processes the queue and, if more is due, fires the next one. A chain of the site calling itself, one admin-ajax request per link.
On this site the chain is the only runner. wp-config.php sets DISABLE_WP_CRON to true, there is no system cron for the account (a state we wrote about in August, still unchanged), and at the time of writing the every-minute action_scheduler_run_queue cron event had not fired since 13 September at 05:26 UTC. The queue moved anyway, 410 to 434 loopback requests a day on twelve of the thirteen full days, because the async runner does not need cron. It needs a request with is_admin() true, and admin-ajax.php sets WP_ADMIN for every caller. The first runner of 3 September fired at 00:08:08, two seconds after an anonymous visitor’s front-page load made its two housekeeping POSTs to admin-ajax (00:08:06, 55 and 78 bytes), which counted as admin requests and dispatched it. The front-end housekeeping calls in row one are what keeps the scheduler alive.
What was in the queue is a single hook, almost entirely:
| Action Scheduler hook | Runs in 14 days | Owner | What it does |
|---|---|---|---|
rank_math/analytics/get_inspections_data | 4,548 (+24 cancelled) | Rank Math | One action per URL, 375 a day, calling Search Console’s URL Inspection API for the Index Status tab. Same 375 URLs every day; 9,842 rows of the 12,398 in the actions table are this hook. |
woocommerce_cancel_unpaid_orders | 295 | WooCommerce | Hourly cleanup of pending orders. |
woocommerce_refresh_order_count_cache | 81 | WooCommerce | Admin order-count badge. |
wcpay_store_setup_sync / wcpay_update_compatibility_data | 54 / 52 | WooPayments | Telemetry and setup sync. |
rank_math/analytics/workflow | 39 | Rank Math | The daily fetch that schedules the 375 above. |
wc-admin_import_orders | 35 | WooCommerce | Analytics import. |
| Cleanup jobs (draft orders, sessions, legacy transients) | 79 | WooCommerce | Daily housekeeping. |
| Google Listings & Ads jobs | ~70 | Google for WooCommerce | Merchant Center syncs. |
actionscheduler_actions table, status complete, last attempt inside the log window. The runner count (5,136) and the inspection count (4,548 plus the other hooks) agree to within a few percent: on this host each inspection took its own loopback request, chained a median 14 seconds apart.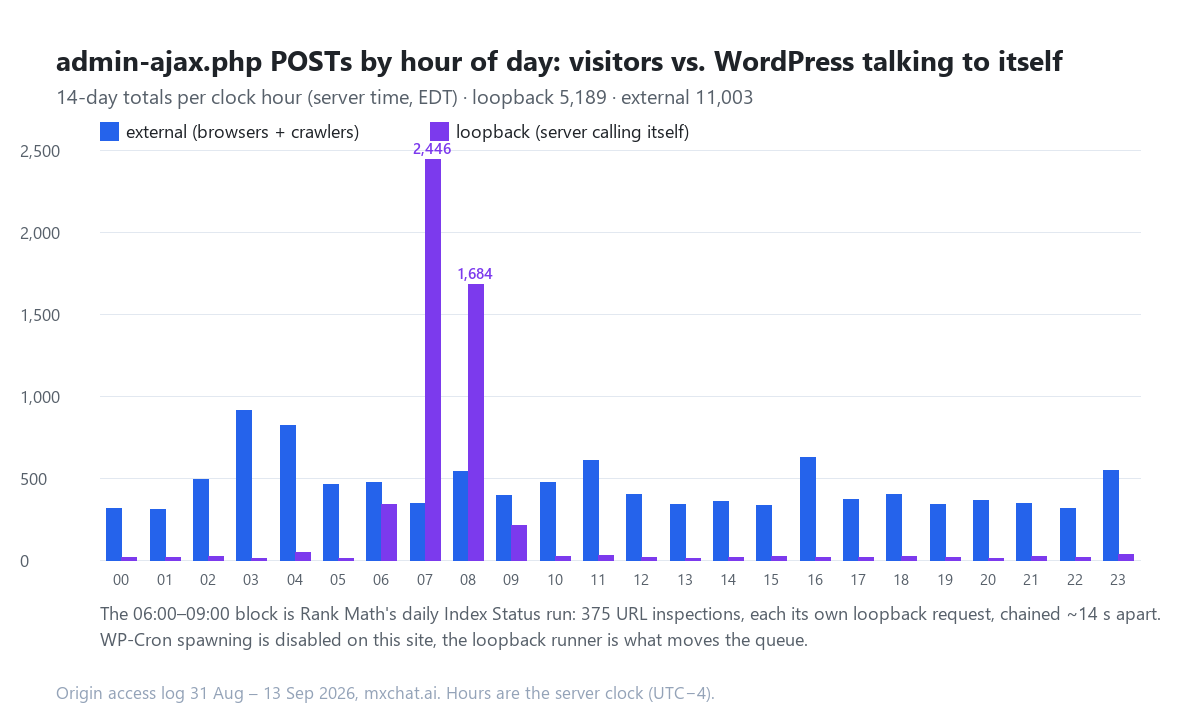
The hour-of-day view makes it visible. Between 06:00 and 09:00 server time, every day, Rank Math schedules its 375 inspections (the actions table shows them created between 10:52 and 11:49 UTC and picked up within minutes) and the runner works through them for about two hours. Outside that block the loopback line is flat at one or two an hour. The Index Status feature is useful; it is also, on this install, the single largest consumer of admin-ajax.php, and every one of its 375 daily requests boots WordPress in full to make one API call. Rank Math caps itself at the API’s 2,000 inspections a day and spreads larger sites over more days, which is considerate to Google’s quota and says nothing about yours.
Row one: two of our own scripts, on every page view
The 8,267 browser requests were the row we expected to be the chat widget. They are not. To find out what they were, we added a nine-line logger to the child theme for the morning (it records the action name of every admin-ajax request to a file outside the web root; it is in the last section). The first twenty minutes logged 99 requests, and 89 of them were two names, alternating: mxchat_woo_get_cart_count (44) and mxchat_check_auth (45). The other ten were four Imagify runner calls, two Jetpack tracking pings, two probes and our own two test calls. The first is the cart badge in the site header, which asks the server how many items are in the cart when the page loads. The second is a script from an internal testing tool that asks whether the visitor is logged in and whether they hold a Pro licence, so it can enable a button. Both run on every page, in every browser that executes JavaScript, whether or not the visitor has a cart or the button exists on that page. Reproduced with their nonces, they return 35 and 66 bytes respectively, which gzip to the 55 and 78 bytes the log recorded 6,635 times.
The chat widget itself, since its REST migration, does none of this on load. Its nonce refresh and session tracking are deferred until the visitor’s first interaction, and the model reply streams over /wp-json/mxchat/v1/stream (283 calls in the window, against 54 conversations). The REST audit from August lists what it exposes. What remains on admin-ajax for the widget is a handful of session calls per real conversation, which at four conversations a day is invisible in a chart of sixteen thousand.
The point is not that a cart badge is a crime. It is that the two most expensive lines in this site’s admin-ajax bill were written by us, fetch information the page could have been rendered with, and nobody had looked. Which brings up the cost.
What one request costs here
We timed it on the server itself, against the origin address, so the CDN and the visitor’s network are out of the picture. Five to ten runs each; medians below.
| Request | Time to response | Notes |
|---|---|---|
| Static file (a 4 KB JavaScript asset) | 10 ms | Apache, no PHP. |
| A bare PHP file that prints “ok” | 10 ms | PHP-FPM is not the slow part. |
WordPress bootstrap only (wp-load.php, no query, no template) | 1,650 ms | 108 database queries, 287 MB peak memory, 48 active plugins and 4 must-use plugins loaded. |
admin-ajax.php with the core heartbeat action | 1,700 ms | Bootstrap plus a trivial action. |
REST route wp/v2/types/post | 1,710 ms | Same bootstrap, same bill. REST is not cheaper per request here; it is cacheable and cleaner, which is a different argument. |
| Front page, at the origin | 1,650 ms | Served from PHP every time; the page cache is not intercepting it. |
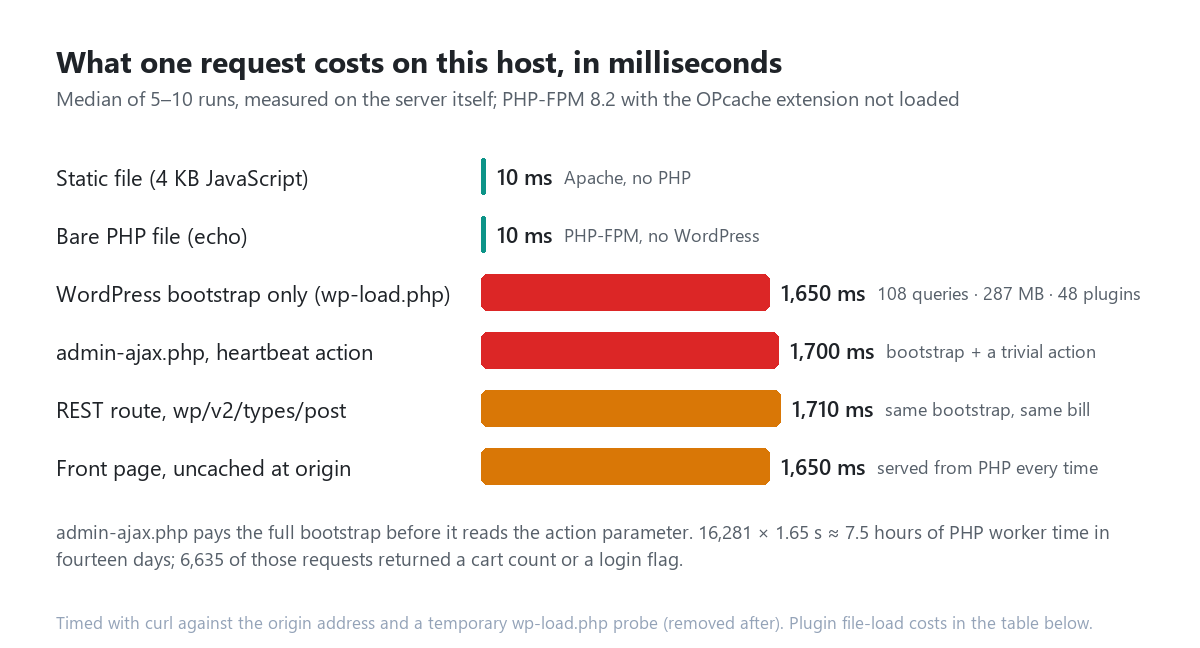
Sixteen hundred milliseconds to boot is slow, and the probe says why in one line: the OPcache extension is not loaded in this host’s PHP-FPM (extension_loaded('Zend OPcache') is false, opcache.enable is false). Without it, every request re-reads and re-compiles every PHP file the 48 plugins pull in. We also timed each plugin’s main file as it loaded, which is the compile-and-include cost before any hook runs:
| Plugin file | Load time (median of 3) |
|---|---|
| A site-specific custom scripts plugin | 160 ms |
| Wordfence | 114 ms |
| WooCommerce | 89 ms |
| WPForms Lite | 56 ms |
| WooPayments | 29 ms |
| bbPress | 19 ms |
| Rank Math SEO | 14 ms |
| MxChat (this site’s chatbot plugin) | 1 ms |
| Everything else, 40 plugins | under 10 ms each |
Callbacks on plugins_loaded and init | ≈ 1,100 ms combined |
plugin_loaded before requiring wp-load.php. The two hook rows are where most of the bootstrap goes: WooPayments, WooCommerce’s package loader, the PayPal integration, WPForms and Imagify each spend 20 to 50 ms initialising, and the block registrations on init add another 30.The arithmetic is the part to keep. 16,281 requests at 1.65 seconds is about 7.5 hours of PHP worker time in fourteen days, thirty-two minutes a day, before any action does any work. 6,635 of those requests, three hours of it, fetched a cart count or a login flag. 5,136 of them, two and a half hours, ran the site’s own queue one action at a time. On shared hosting that time is your CPU-seconds allowance; on a VPS it is worker slots that a real visitor’s page has to wait for.
Update, 16 September 2026. Two corrections to the OPcache paragraph, both from measuring it properly the next morning. First, the extension is not disabled, it is not installed: the EasyApache PHP 8.2 modules directory has no opcache.so, so the switch is the ea-php82-php-opcache package in WHM, held by the server administrator, not a setting in the account’s hosting panel. Second, OPcache is only half of the bootstrap. A SAVEQUERIES probe found one query taking 480 of the 1,650 ms: WordPress loading every usermeta row for user 1 on every request, 85 MB of it, written by one of our own add-ons. Both are laid out with the numbers in PHP OPcache off: where 1.6 s of a WordPress request goes.
The 89 GET requests: a catalogue of what people probe for
admin-ajax is also where automated scanners go looking for plugins with known unauthenticated actions, because a GET with the right action name tells them instantly whether the plugin is installed. Fourteen days produced a tidy list.
| Action probed | Requests / addresses | What it targets | Result here |
|---|---|---|---|
wdpsso_step1 | 26 / 6 | CVE-2026-76581, WPMU DEV Dashboard ≤ 5.0.1, an unauthenticated bypass to an administrator session, CVSS 9.8, published 28 August. First probe here on 1 September, four days later; eleven more since the window closed. | Plugin not installed; 403. |
duplicator_download | 2 / 2 | The 2020 Duplicator arbitrary-file-download bug, still being tried six years on. | Not installed; 403. |
revslider_show_image, kbslider_show_image | 1 / 1 each | The 2014 slider file-read bugs. | Not installed; 403. |
generate_wpo_wcpdf | 5 / 3 | Invoice-PDF retrieval without a valid key, patched in WooCommerce PDF Invoices years ago. | Installed; the plugin refused every one (“empty access key”), as a 200 with an error page. Reproduced by hand. |
wp_mail_smtp_export_settings, post_smtp_export | 1 / 1 each | Settings export (which would include SMTP credentials) on SMTP plugins. | 403. |
woocommerce_load_status_widget | 3 / 2 | Fingerprinting WooCommerce’s presence. | 200, 0.8 KB; not reproduced, so not explained. |
download_file, empty action | 2 | Generic. | 400. |
wordfence_doScan GETs are Wordfence’s own scanner stepping through a scan and are excluded. The WPMU DEV probes arrived from six addresses across eight of the fourteen days.None of it landed, and the 403s are the firewall doing its job. The lesson is the timing on the first row: a critical disclosure on a Thursday, scanners at your admin-ajax by the following Tuesday. That window is what the auto-update post is about, and it is also why “just block admin-ajax.php” is a common and wrong reaction: the same file serves the cart badge, the contact form and the chat widget. You cannot block the door; you can only be careful what is behind it.
What to do, in order
| Step | What it fixes | How | Expected effect here |
|---|---|---|---|
| 1. Find your own callers | The rows you did not know about | Log the action of every admin-ajax request for a day (snippet below), or read the access log for loopback and GET query strings. | Two scripts, 6,635 requests, found in fifteen minutes. |
| 2. Turn on OPcache | The 1.65 s bootstrap every request pays | Hosting panel → PHP extensions → opcache. Server configuration, not WordPress. | Not measured yet; it is the first thing we will report when it is enabled. Everything below is a request count; this is the per-request price. |
| 3. Stop fetching on load what the page already knows | Row one | Render the cart count and login state into the page (they are known when the HTML is built) and only call back on change. Or use WooCommerce’s own wc-ajax fragments, which are built for this. | −6,635 requests a fortnight, −3 hours of PHP time. |
| 4. Run the queue from a real cron | Row two | A system cron that runs wp action-scheduler run (WP-CLI) every minute or two, then return false on the action_scheduler_allow_async_request_runner filter so the loopback chain stops. Do the same for WP-Cron itself with wp cron event run --due-now, since it is currently not running at all. | −5,136 loopback requests; the same work done in one CLI process instead of 375 web requests. |
| 5. Decide whether you need Index Status daily | Rank Math’s 375 | Rank Math → Analytics → Index Status toggle. Keep it if you read the tab; the API data does not change daily for most URLs. | Up to −4,548 actions a fortnight. |
| 6. Slow the heartbeat | Row six, on busier sites | The heartbeat_settings filter, interval in seconds; or disable it outside the post editor. | Negligible here (47); real on sites with many editors. |
| 7. Move plugin endpoints to REST | Cacheability, not cost | Register routes with register_rest_route; the per-request bootstrap is the same, but GET responses can carry cache headers and the URL says what it does. | The chat widget did this; its load-time admin-ajax calls went to zero. |
| 8. Do not block admin-ajax.php at the edge | Nothing; it breaks things | Rate-limit per address instead, generously: a rendering crawler makes several hundred legitimate POSTs an hour (verify which crawlers are real first). | — |
The logger from step 1, for a child theme’s functions.php, writes one tab-separated line per admin-ajax request to a file outside the web root. Leave it in for a day, sort the third column, remove it:
add_action( 'admin_init', function () {
    if ( ! ( defined( 'DOING_AJAX' ) && DOING_AJAX ) ) { return; }
    $a  = isset( $_REQUEST['action'] ) ? substr( preg_replace( '/[^a-zA-Z0-9_\-\/]/', '', (string) $_REQUEST['action'] ), 0, 60 ) : '-';
    $ua = isset( $_SERVER['HTTP_USER_AGENT'] ) ? substr( $_SERVER['HTTP_USER_AGENT'], 0, 40 ) : '-';
    $rf = isset( $_SERVER['HTTP_REFERER'] ) ? substr( $_SERVER['HTTP_REFERER'], 0, 80 ) : '-';
    @file_put_contents( dirname( ABSPATH ) . '/ajax-actions.log',
        gmdate( 'c' ) . "\t" . $_SERVER['REQUEST_METHOD'] . "\t" . $a . "\t" . ( is_user_logged_in() ? 'auth' : 'nopriv' ) . "\t" . $ua . "\t" . $rf . "\n",
        FILE_APPEND | LOCK_EX );
}, 1 );
It hooks admin_init, which admin-ajax fires after bootstrap and before the action, so it sees every request including the ones no function claims. On this site it will show you the cart badge and the auth check within a minute of going live, and the Action Scheduler runner the next time anything is due.
Questions this usually raises
Is admin-ajax.php slow? No slower than any other WordPress request; it just cannot be cached, so it is the request you notice. On this host every PHP request costs 1.65 seconds of bootstrap, and admin-ajax gets the blame because 16,281 of them arrived at one URL.
Why does admin-ajax.php return 0 with a 400? No function is registered for the action you sent, for that login state. The commonest cause is a plugin that registered wp_ajax_x but not wp_ajax_nopriv_x, so logged-out visitors get the 0. The second commonest is a scanner guessing names, which is what most of the 400s in the table above were.
Should I block it in Cloudflare or .htaccess? No. On this site that would break the cart badge, the contact forms, the chat widget’s session calls and the background queue in one move. Rate-limit per address if you must, with a ceiling a JavaScript-rendering crawler can live under.
Is the REST API faster? Not per request, as the table shows: 1,710 ms against 1,700 ms, because both boot the same WordPress. REST is better because GET routes can be cached, the URLs are self-describing, and the permission model is explicit. The Delicious Brains comparison reached the same conclusion on a different host in 2023.
Does a chatbot plugin add much admin-ajax load? Ours adds a few session calls per conversation and streams replies over REST; the load-time calls that used to exist were the first thing its REST migration removed. If you are evaluating one, the honest question to ask the vendor is what its widget does on page load before anyone types, because that number multiplies by every page view, and the answer for MxChat Pro is documented in the docs. The setup guide covers where the widget’s requests go once it is installed.
Where this leaves us
One file, one fortnight, 16,281 requests. Half of them were our own header asking for two numbers it could have been handed. A third were the site running its own errands one HTTP request at a time because nothing else runs them. A sixth were crawlers dutifully executing the same header scripts. Sixty-eight were strangers trying door handles, twenty-six of them for a bug that was four days old when they started. The chatbot, the thing this site exists to sell, was a rounding error in the count and the cheapest plugin in the load table.
The number that changes everything is not in the log. It is the 1.65 seconds, which is a hosting switch. We will publish the before-and-after when it is flipped, and the request counts after steps 3 and 4 ship. Until then, the count above is what a busy WordPress site looks like from the inside, and if yours has never been sorted this way, the logger takes nine lines.