PHP OPcache Off: Where 1.6 s of a WordPress Request Goes
PHP OPcache is the part of PHP that keeps compiled scripts in memory so the next request does not have to read, lex, parse and compile them again. It has shipped with PHP since 5.5, it is on by default in most PHP builds, and on this host it is not loaded at all. WordPress 7.0 added a Site Health test for exactly that in May 2026. The test has been sitting in our Site Health screen with the label “Opcode cache is not enabled” for as long as this site has been on 7.x, and nobody, including me, read it until this week.
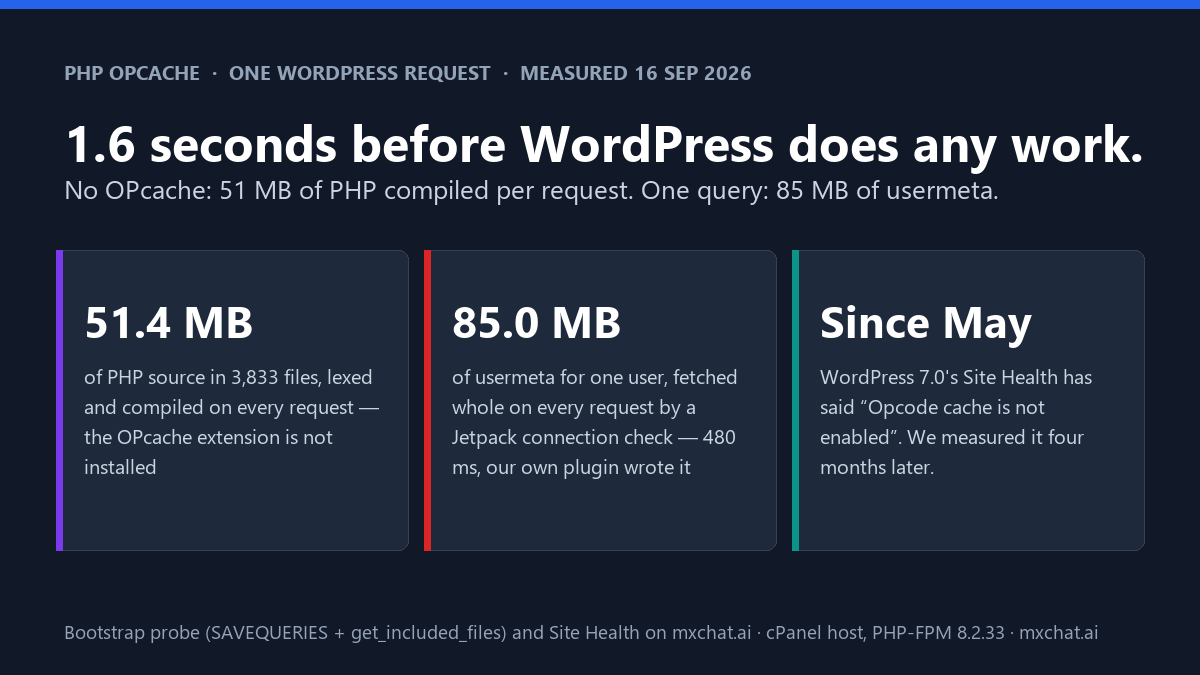
So I measured what it costs. I put a twenty-line probe in the child theme, booted wp-load.php six times through PHP-FPM at the origin, and recorded the total, the database time, every file PHP had to include, and peak memory. The headline: 1,638 ms before WordPress does any work, on every request that reaches PHP: 108 database queries, 3,833 PHP files totalling 51.4 MB of source, and 287 MB of memory. Bare PHP on the same server answers in 10 ms. A static file answers in 10 ms. Everything between 10 and 1,638 is WordPress and its 48 plugins being reassembled from source, plus one database query that I did not expect and that turned out to be a third of the whole thing.
This is the third post in a row where the site’s own log or its own database is the spine (the admin-ajax.php count found our two worst callers were ours; the denial-of-wallet piece found a rate limiter that did not hold). This one is the same shape: two causes, both fixable, one of them ours again.
What one request costs here, partitioned
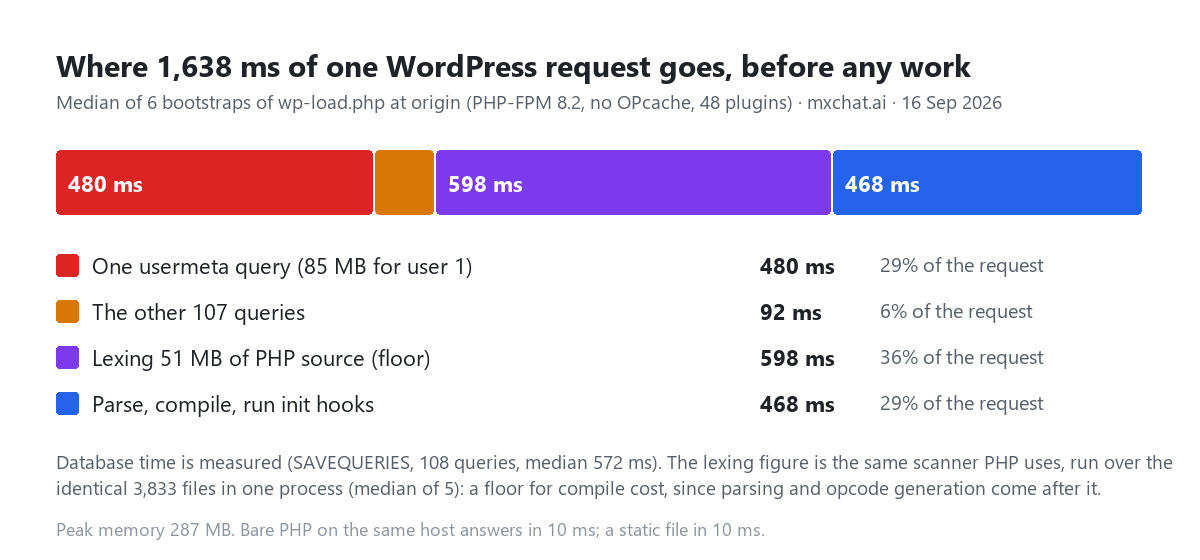
The probe is nothing clever. It defines SAVEQUERIES, requires wp-load.php, and then reads what WordPress leaves behind: $wpdb->queries for every query with its duration and call stack, get_included_files() for every PHP file the bootstrap pulled in, and memory_get_peak_usage(). Six runs, a minute apart, through the origin with Cloudflare bypassed so the edge could not cache anything:
| Run | Total (ms) | Database (ms) | Queries | Files included | Source (MB) | Peak memory (MB) |
|---|---|---|---|---|---|---|
| 1 | 1,736 | 604 | 108 | 3,833 | 51.4 | 287 |
| 2 | 1,673 | 524 | 108 | 3,833 | 51.4 | 287 |
| 3 | 1,623 | 571 | 108 | 3,833 | 51.4 | 329 |
| 4 | 1,654 | 585 | 108 | 3,833 | 51.4 | 287 |
| 5 | 1,581 | 542 | 108 | 3,833 | 51.4 | 351 |
| 6 | 1,590 | 572 | 108 | 3,833 | 51.4 | 327 |
| Median | 1,638 | 572 | 108 | 3,833 | 51.4 | 287 |
Two things fall straight out of the table. The database is 572 ms of the 1,638, so about a third, and the file count and byte count never move: WordPress includes the same 3,833 files on every request whether or not anyone is logged in, whether the URL is the homepage or a REST endpoint or admin-ajax.php. The other two thirds is PHP reading itself. I could not measure the compile stage directly on this host (there is no OPcache to compare against, which is the point), so I did the next honest thing: I ran PHP’s own scanner, token_get_all(), over the identical 3,833 files in a single process. That is 8.29 million tokens and it takes 598 ms (median of five). Lexing is the first stage of compilation, before the parser and the opcode generator do their work, so 598 ms is a floor for what OPcache would remove, not an estimate of it.
Half of it: 51 MB of PHP, compiled from source on every request
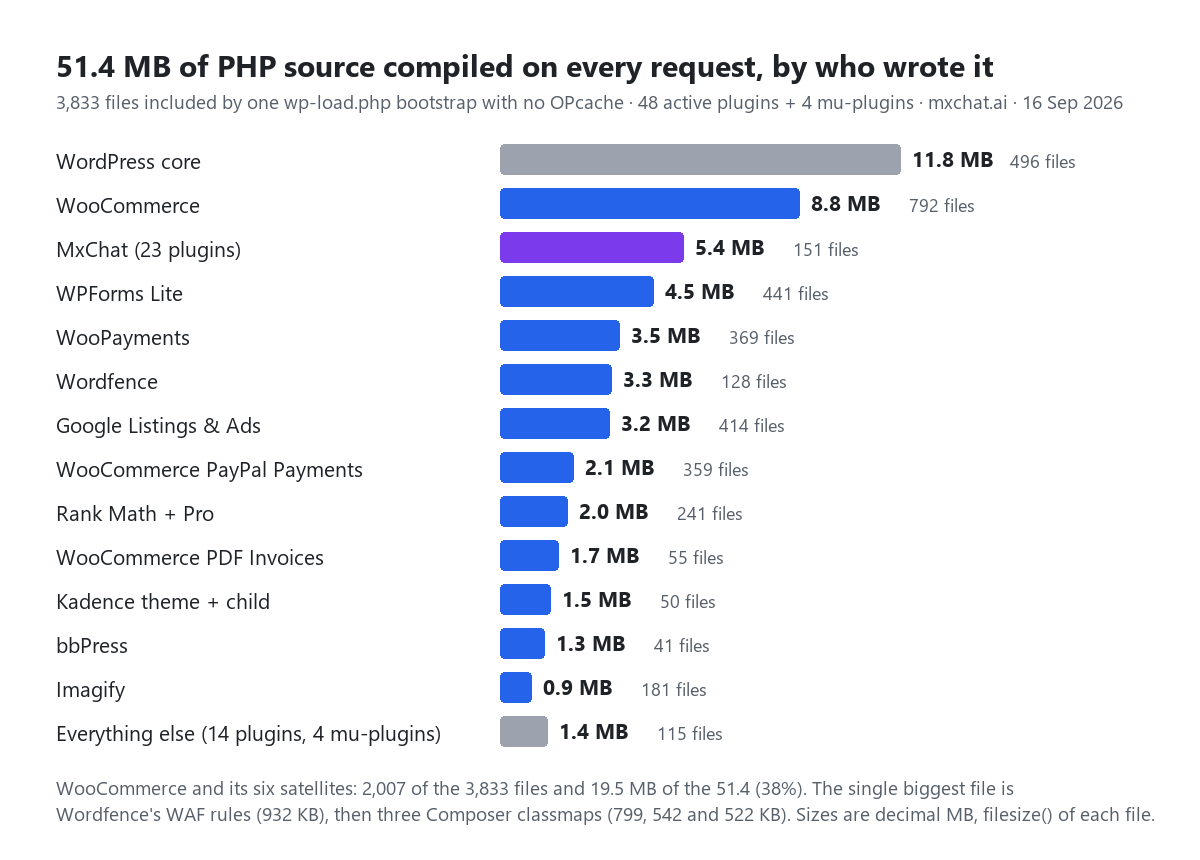
Without an opcode cache, PHP treats every request as the first one. Each of the 3,833 files is opened, read, tokenised, parsed into an AST, compiled into opcodes, executed, and thrown away. With OPcache loaded, the compiled opcodes for each file stay in shared memory and the next request skips straight to execution. The php.net manual describes it in one sentence; what it does not tell you is how much source your particular site is recompiling. Here it is 51.4 MB, and the table of who wrote it is more useful than the total:
| Author | Files | Source | Share |
|---|---|---|---|
WordPress core (wp-includes, root, wp-admin) | 496 | 11.8 MB | 23% |
| WooCommerce + six satellites (Payments, PayPal, PDF Invoices, Google Listings & Ads, Software Add-on, Update Manager) | 2,007 | 19.5 MB | 38% |
| MxChat, 23 plugins | 151 | 5.4 MB | 10% |
| WPForms Lite | 441 | 4.5 MB | 9% |
| Wordfence | 128 | 3.3 MB | 6% |
| Rank Math + Pro | 241 | 2.0 MB | 4% |
| Everything else (theme, bbPress, Imagify, 14 more plugins, 4 mu-plugins) | 369 | 5.0 MB | 10% |
Three observations, in order of surprise. First, WooCommerce and the plugins that orbit it are more than half the files and nearly two fifths of the bytes. That is not a criticism of WooCommerce; it is what a modern PHP application looks like when it ships its Composer dependencies, and it is exactly the shape of codebase OPcache exists for. Second, the largest single file PHP compiles here is not a class at all: it is wp-content/wflogs/rules.php, Wordfence’s generated firewall ruleset, at 932 KB. The next three are Composer classmaps (Google Listings & Ads 799 KB, WooCommerce’s Jetpack classmap 542 KB, WPForms 522 KB), which are enormous PHP arrays that exist so the autoloader does not have to search the disk. Without OPcache, every one of them is re-parsed on every request to save a directory lookup that would have been cheaper. Third, our own 23 plugins are 5.4 MB of the 51.4, and class-mxchat-integrator.php alone is 650 KB, the third-biggest file on the site. Every chat message, every REST call from the widget, pays to recompile it. I will come back to what that means for a chatbot.
Why it is off, and whose switch it is
This is a cPanel host on EasyApache’s PHP 8.2.33 with PHP-FPM. The reason OPcache is off is not a setting: the extension is not installed. The modules directory (/opt/cpanel/ea-php82/root/usr/lib64/php/modules/) has dozens of extensions in it and no opcache.so, and extension_loaded('Zend OPcache') returns false from both the FPM pool and the CLI. On EasyApache the extension is a separate package, ea-php82-php-opcache, installed from WHM’s EasyApache 4 screen by whoever has root, which is not the account owner. Yesterday’s post said this was “a cPanel checkbox”. It is a checkbox, but on the server administrator’s screen, not the site owner’s. If your host runs CloudLinux’s PHP Selector you will see opcache in the extensions list for your account and can tick it yourself; on plain EasyApache you have to ask.
How to check yours in one minute
Three ways, in ascending order of effort:
- Site Health. Tools → Site Health → Status. On WordPress 7.0 or later, look under “Recommended improvements” for Opcode cache is not enabled. The test is
get_test_opcode_cache()inclass-wp-site-health.php, tagged@since 7.0.0; it callsopcache_get_status()and reports “recommended” when the function is missing or the cache is disabled. Ours says exactly that, and so does its neighbour, You should use a persistent object cache. - WP-CLI.
wp eval 'var_dump( extension_loaded( "Zend OPcache" ) );'tells you about the CLI binary, which on many hosts is a different PHP build from the one serving your pages. Useful, but not conclusive on its own. - A one-line file served by your actual web PHP. Put
<?php echo extension_loaded('Zend OPcache') ? 'on' : 'off', ' ', PHP_SAPI;in a file under your theme, fetch it in a browser, delete it. That is the answer for the process that serves your visitors. Ours returnsoff fpm-fcgi.
A third of it: one query that returns 85 MB
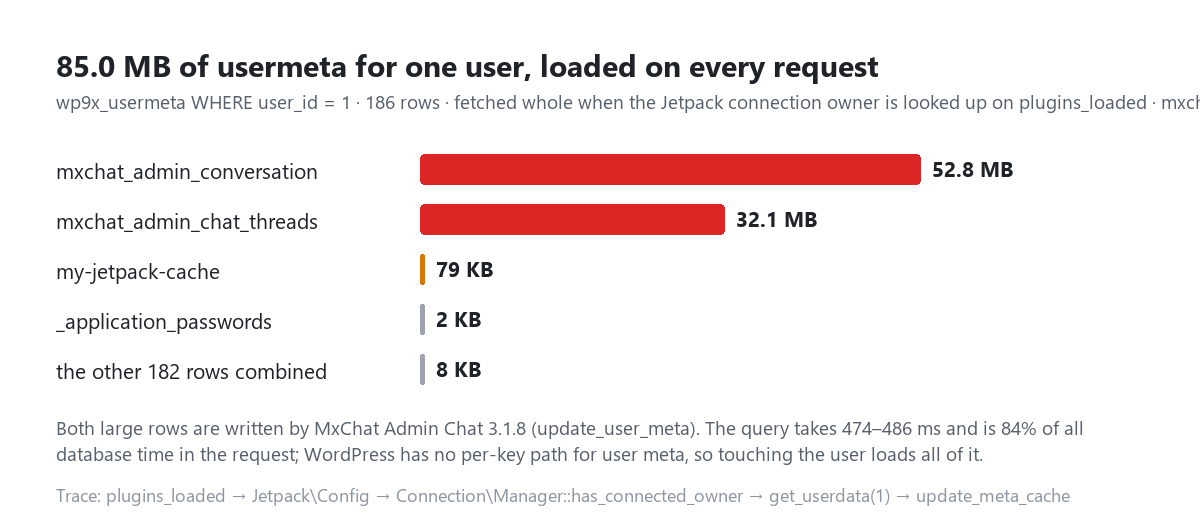
The database side was supposed to be the boring half. 108 queries in 572 ms is unremarkable for a WooCommerce site until you sort them by duration, at which point the list is one query and then silence:
| Duration | Query |
|---|---|
| 485.5 ms | SELECT user_id, meta_key, meta_value FROM wp9x_usermeta WHERE user_id IN (1) ORDER BY umeta_id ASC |
| 4.2 ms | SELECT option_name, option_value FROM wp9x_options WHERE autoload IN (...) (the autoloaded options) |
| 2.4 ms | WooPayments transient lookup |
| 2.2 ms | ptk_patterns option (WooCommerce pattern toolkit) |
| 1.2 ms | SHOW TABLES LIKE 'wp9x_mxchat_processing_queue' |
One query is 84% of all database time in the request, and it is fetching every meta row for user 1 on an anonymous front-end request that never mentions user 1. The SAVEQUERIES call stack says who asked. On plugins_loaded, the Jetpack Config package (shipped inside WooPayments, which uses the Jetpack connection to talk to WordPress.com) calls Connection\Manager::has_connected_owner(), which calls get_connection_owner(), which calls get_userdata(1). Building a WP_User means reading its capabilities, which are stored in usermeta, and WordPress’s update_meta_cache() has no per-key path: it loads every row for that user and caches them all. Normally that is a few kilobytes and nobody notices.
User 1’s usermeta is 186 rows and 84,989,232 bytes. Two rows are 99.9% of it: mxchat_admin_conversation at 52.8 MB and mxchat_admin_chat_threads at 32.1 MB. Both are written by our own MxChat Admin Chat add-on (3.1.8), which stores the site owner’s entire admin-side chat history as serialized arrays in user meta via update_user_meta(), with a code comment explaining that user meta is “faster than transients”. It is, for the admin screen that reads it. It is also transferred from MySQL to PHP on every request the site serves, unserialized, and held in the object cache for the life of the request, which is where most of the 287 MB peak comes from. For a table that is 117.5 MB on disk, one user is 85 MB of it.
To be clear about the causal chain, because it is easy to point at the wrong party: Jetpack’s connection check is a reasonable thing to do on plugins_loaded, and loading all of a user’s meta is how WordPress has always worked. The defect is storing 85 MB of conversation logs in a table WordPress reads whole. That is ours, it is fixable in a day (a custom table, or one row per thread, or at minimum autoload-style separation), and a plan is filed with the product side. Until it ships, this site pays 480 ms per request for a feature exactly one person uses.
What Site Health knows, and what it cannot
The interesting thing about this morning is that half of it was already on a screen in the admin. WordPress 7.0 added an opcode-cache test to Site Health, beside the persistent-object-cache test that has been there since 6.1, and both report “recommended” here. If you have not opened Tools → Site Health since spring, do; the labels are new. Ours currently lists four “recommended” items in a row: the opcode cache, the object cache, PHP 8.2 being older than it would like, and A scheduled event has failed, which is the polite way of saying WP-Cron has not fired since 13 September, and the next morning’s access log said who had been running it until then. Four honest flags on one screen, all read this week. The 85 MB query, on the other hand, is invisible to Site Health, to Query Monitor’s default view (it shows the query and the time, but not why an anonymous request touches user 1), and to every page-speed tool, which measure the response and not its composition. It took SAVEQUERIES and the call stack to find it, which is the argument for the probe: Site Health tells you the switches that are off; only your own database tells you where your bytes are.
What this costs a chatbot
Every message a visitor sends to an on-site chatbot is a request to your server, a REST call on this plugin (one of the 966 routes this site exposes), and on WordPress that means a full bootstrap before the plugin’s first line runs. Our older chatbot performance guide talks about lazy-loading the widget and trimming the knowledge base; those are real, and they are small next to this. On this host that is 1.6 seconds before MxChat has even read the message, and it is the same 1.6 seconds whether the reply is a two-word FAQ answer or a long retrieval-augmented one. We have measured what a reply costs in tokens on this site down to the hidden thinking budget; this is what it costs in time before the model is called, and it is the larger number. The two fixes above are worth about 1.1 s of it on the floor estimate, which is the difference between a widget that feels like a chat and one that feels like a form submission. The documentation covers the plugin’s own settings; none of them can make wp-load.php faster. That is your host’s switch and your database’s contents.
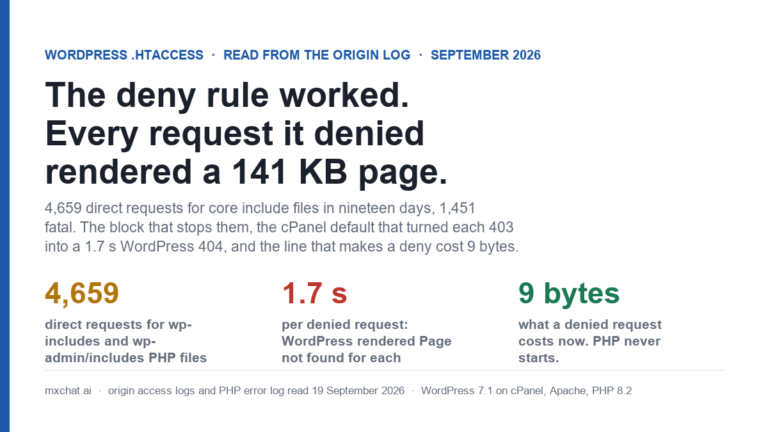
Update, 19 September: the same bootstrap is paid about a thousand times a day on this host by WordPress rendering its 141 KB Page not found for scanner misses, and until today by every .htaccess deny rule as well, because a cPanel default handed each Apache 403 to WordPress. The count, the timing in five configurations and the one-line fix are in the .htaccess deny post.
Update, 21 September: MxChat Admin Assistant 3.1.10 (released 20 September) moves the saved conversations out of the user profile and into two dedicated tables, with a compressed backup written to wp-content/uploads/mxchat-admin-chat before anything is removed. The move runs the first time the WordPress admin is opened after the update, and on this site that has not happened yet: at 07:54 UTC on 21 September the two usermeta rows still held 81.1 MB (50.4 MB of conversation, 30.6 MB of thread index) and the 480 ms query was still in every request. The before-and-after timing goes here the morning after it runs.
What to do, in the order that pays
- Get OPcache installed. On cPanel/EasyApache, ask for the
ea-php8x-php-opcachepackage for your PHP version (it is one line in WHM → EasyApache 4 → Customize → PHP Extensions). On CloudLinux PHP Selector, tickopcache. On a VPS you manage,apt install php8.2-opcacheor the equivalent, then confirmzend_extension=opcacheis loaded in the FPM pool, not just the CLI. Defaults are fine to start:opcache.memory_consumption=128holds this site’s 51 MB of source with room to spare, andopcache.max_accelerated_files=10000is comfortably above our 3,833. - Find your own 85 MB. One query:
SELECT user_id, COUNT(*), SUM(LENGTH(meta_value)) FROM wp_usermeta GROUP BY user_id ORDER BY 3 DESC LIMIT 5;. Anything over a megabyte for one user is a plugin using usermeta as a log. The same query onwp_options WHERE autoload='yes'finds the equivalent problem on the options side. Then ask the plugin author for a custom table. - Run the probe before and after. The twenty lines below, served from your theme directory and deleted afterwards. If OPcache is the win the manual says it is, the total falls and the file count does not; if the file count falls, a plugin was deactivated and the comparison is void.
- Then, and only then, a persistent object cache. Redis or Memcached would cache the 85 MB blob rather than fix it, and on a site with one query problem it is the wrong first move. Once the query is gone, the remaining 92 ms of database time is a good candidate.
<?php
// serve from your theme dir, then delete. Bypass any page cache/CDN when fetching.
define( 'SAVEQUERIES', true );
$t0 = microtime( true );
require dirname( __DIR__, 3 ) . '/wp-load.php';
$t1 = microtime( true );
global $wpdb;
$db = 0; foreach ( $wpdb->queries as $q ) { $db += $q[1]; }
$files = get_included_files(); $bytes = 0;
foreach ( $files as $f ) { $bytes += filesize( $f ); }
header( 'Content-Type: text/plain' );
printf( "total %.0f ms | db %.0f ms in %d queries | %d files, %.1f MB | peak %.0f MB | opcache %s\n",
  ( $t1 - $t0 ) * 1000, $db * 1000, count( $wpdb->queries ), count( $files ), $bytes / 1e6,
  memory_get_peak_usage( true ) / 1048576, extension_loaded( 'Zend OPcache' ) ? 'on' : 'off' );
usort( $wpdb->queries, fn( $a, $b ) => $b[1] <=> $a[1] );
foreach ( array_slice( $wpdb->queries, 0, 3 ) as $q ) { printf( "%.1f ms  %s\n  %s\n", $q[1] * 1000, substr( $q[0], 0, 100 ), $q[2] ); }
Questions this usually raises
Does OPcache replace a caching plugin?
No, and they do not overlap. A page cache (W3 Total Cache, WP Rocket, the host’s own) serves a stored copy of the HTML and skips PHP entirely for the requests it can serve. OPcache makes every request that does reach PHP cheaper, which is every logged-in page view, every REST and admin-ajax call, every chatbot message, every WooCommerce cart action, and every uncached page. Our admin-ajax count found 16,281 of those in a fortnight on this site; none of them can be page-cached, and every one of them pays the 1.6 s.
Will OPcache serve stale code after I update a plugin?
Not with the defaults. opcache.validate_timestamps=1 and opcache.revalidate_freq=2 mean PHP checks a file’s modification time at most every two seconds and recompiles when it changes. Hosts that set validate_timestamps=0 for maximum speed must clear the cache on deploy; if your host does that, plugin updates through the admin still work because WordPress calls opcache_invalidate() on the files it writes.
Is 51 MB of source a lot?
It is on the large side for a marketing site and ordinary for a WooCommerce store with a payment gateway, a forms plugin and a security plugin. The number to watch is not the total but whether it is recompiled per request. With OPcache, 51 MB compiles once per deploy and is then served from memory; without it, the 16,281 admin-ajax.php requests this site answered in the last fortnight alone recompiled 51.4 MB each, about 837 GB of PHP source read and thrown away, before counting a single page view or REST call.
Why does WordPress load all of a user’s meta?
Because get_user_meta() is backed by a per-object cache that is populated in one query, and the design predates plugins storing megabytes there. The capabilities check that triggers it (WP_User::get_caps_data()) needs one key, but the cache is filled per user, not per key. This is the same class of problem as autoloaded options growing past a few hundred kilobytes: the mechanism is fine, and it stops being fine when a plugin treats it as a log store.
Should I be worried about the 287 MB peak?
Watch it after the usermeta fix. Most of the peak is the 85 MB blob passing through the MySQL client, PHP and the object cache. Once that is gone I expect the bootstrap to land near 100 MB, which is where a site with this plugin count belongs. If it does not, the next probe is per-plugin memory, and that is a different post.
Where this leaves us
Two requests to the people who hold the switches, and one promise. The host administrator has been asked to install the OPcache extension; the product team has a plan to move the admin chat history out of usermeta. When either lands, I will re-run the same probe, same six runs, and put the before-and-after in this post as a dated update. The prediction, for the record: OPcache alone takes the median from 1,638 ms to somewhere between 700 and 900 (the lexing floor of 598 plus whatever parse and compile cost above it), and the usermeta fix takes another 480 off whatever is left. If those numbers are wrong, that will be here too. A site that spends 1.6 seconds getting ready to answer has not started being slow yet; it is slow before the question arrives.